 The World Podcast Network is always collecting data on engagement and interaction just like Buzzsprout, Anchor and PodBean do or Google does for websites. With that data collection, we also provide analytics for your podcast.
We constantly measure engagement of the visitors coming to our podcast network. Visitors can be from our own marketing of your podcast, marketing of our network, and your own visitors. We also believe that our analytics are more complete and accurate than the ones from your podcast hosting platforms like Anchor, Buzzsprout, etc. We started collecting the data in the second quarter of 2021 and presented the podcast network analytics in the third quarter of 2021. This is just part 1 of a multi-part series on how we collect data on your podcast and how we present the metrics.
We want all podcasters on our network to know what type of interaction is happening on our network as opposed to the analytics you may receive on your podcast hosting platform. We measure everything from location including city and country, number of views, number of downloads and even your most popular episodes. We are always looking to improve our data collection methods and new ways to present the metrics to you, because we want you to have the full picture of what’s happening on your podcast with relation to our podcast network.
How to view your analytics
Every podcaster, on the professional level has access to their analytics. Simply log into the portal at https://worldpodcast.network/my-podcast/dashboard and click on Advanced Analytics on the left.
How to read your analytics
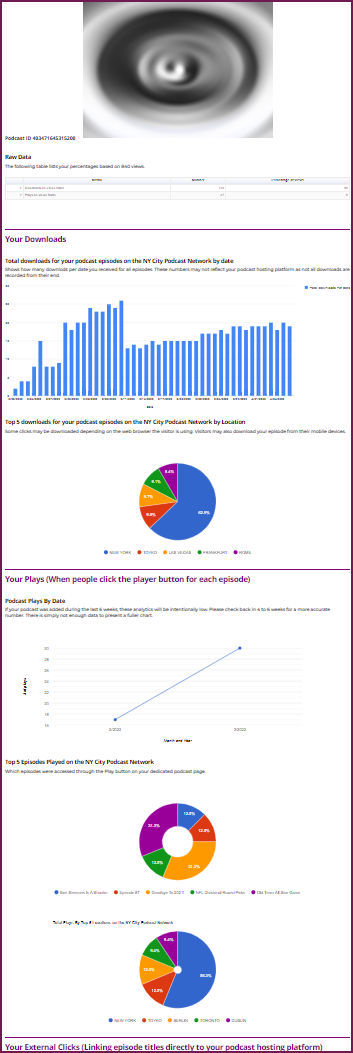
You can see a small low-resolution screenshot of the analytics to the right. The podcast’s information has been blurred out as this is private data to each podcaster. This section is dedicated to highlighting the different sections of your analytics. Please keep in mind that we are always adding new sections and this article may accidentally omit a section that you see on your analytics report. As a result, this section could become outdated until this article is updated, but as of the time of writing this blog post, Wednesday, April 6, 2022, everything is up to date.
Let’s begin with your raw data
Your raw data is the actual data of the engagement. We present two metrics in an easy-to-read table:
First of all, what is a view for your podcast?
We base everything on the number of views. We count all views as a single page visit, even return visits. This means that if your podcast audience member returns to your dedicated podcast page 3 times, we count 3 views. This is because we want you to know all of the visits. At this time, we do not present the data on unique visits, but we hope to in the near future.
Downloads-to-Views Ratio
Since we measure downloads and views, we can present both in relation to each other. This is the total amount of direct downloads that have been received. A direct download occurs when a visitor has clicked on the MP3 link below your episodes and either a) saved it to their local computer or b) launched it in the browser, usually through a new browser tab automatically opened in the web browser. The World Podcast Network has no control over which one occurs since the action is usually set in the visitor’s web browser. Either way, you can see the number your episode MP3s (or WAVs) were clicked.Percentage of Views
We take the percentage of downloads over views. For example, if you have 10,000 downloads over 100,000 views, this percentage will be 10%. We see on our podcast network that the best podcasts are scoring around a 2 to 4% of the percentage of the Plays-to-Views Ratio. Anything higher than that is icing on the cake and an indication that your podcast is performing well.Plays-to-Views Ratio
Most podcast episodes include a built in player. We give our visitors the chance to play your episode right there on your dedicated podcast page. A “play” counts when the Play button is clicked, similar to a play on YouTube. We register plays immediately when the button is clicked and do not limit plays to a minimum of 30 seconds like YouTube or other podcast hosting platforms do. This ratio is the number of plays divided by the number of views. For example, if you have 5,000 views and the play button is clicked 2,000 times, your ratio would be 40%. This number can also be MORE than the 100%. That is because a single visitor could play one or more of your episodes in one visit. For example, if you have a one page visit, but the visitor plays 3 of your episodes, this will be 300% for that one visitor. Of course, not all of our visitors will play your episodes once per visit, but some podcasts do have this ratio over 100. If this is YOUR podcast, then congratulations. You are hooking the visitor and they like your episodes.
If your Plays-to-Views Ratio is under 2%, it could mean that our visitors are not engaging with your podcast and we notice some of the root causes:
- With almost 700 podcasts as of the time of this writing, podcasts can be competitive within any platform including Spotify, Apple, Libsyn or any other aggregator or platform. The most recent episodes every single day show up on our home page which is the most trafficked web page on our network. Our visitors look at the home page and shop the newest episodes. We notice that the podcasts with the low ratios do not publish as often as the podcasts with higher ratios. Some podcast episodes are published 3 to 5 times weekly and those episodes always remaining on our home page. Podcasts that publish episodes once per week or less frequently will not have as much coverage.
- Your podcast level is not high enough. The free podcasts on our network do not have their episodes showing on the home page, so they will not see engagement as often. The Professional-level podcasts see the most exposure as we publish their episodes in multiple places on the network including higher rankings in search results, our podcast directory, and category pages.
- Your podcast description may not have enough information. Our search results page is a very popular one as well as the home page. Visitors are always searching for the information they want. Search results show podcast titles and their descriptions. If you would like to come up more in search results, consider publishing episodes more often. If you need to change your description, please send us a message from our contact form and select “Update My Podcast Information” from the drop down menu. Please note that Standard and Professional-level podcasts will receive faster support than free-level podcasts.
- You are not getting enough votes on the Daily Podcast Leaderboard – The leaderboard is a daily listing of the most popular podcasts. Podcasts rise and fall in the rankings based on votes from your audience members or other visitors of our podcast network. The higher your podcast moves on the leaderboard, the better chance you will pick up new audience members who will play and listen to your podcast episodes, improving your analytics.
We thank you for reading this article as it answers a lot of the questions we receive from podcasters about their analytics. Check back often as we are adding more blog posts to explain the podcast analytics and how we collect data on your podcast’s engagement.
Your best episodes
The advanced analytics also show your most popular episodes along with a pie chart of the amount of downloads.Your most popular cities
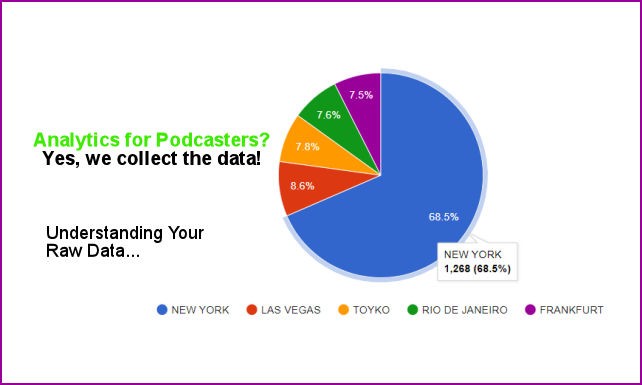
The podcast network also receives traffic from people seeking quality podcasts and episodes from around the world. We currently receive traffic from over 200 US and international cities. The advanced analytics will show you where people are tuning in.More articles for our podcaster community
Listen to our podcast on podcasting success!

- Fortune Cookie Readings For The 20 Most Active Podcasters On The World Podcast Network!!! S3 E18
- The RIGHT Social Network For Your Podcast | S3 E17
- Does Your Podcast Have TOO Many Guests With Shari Post? S3 E16
- How Podcasters Can Succeed By Following Hulu's Strategy | S3 E15
- Guest Jodi Krangle Of The Audio Branding Podcast And The Podsafe Music Of Jess King | S3 E14 | Become A Successful Podcaster
- Podcast Guest Steve Guttman And The Podsafe Music Of Zaneta Z
- Podcaster Journey With Rapper And Podcaster Pryme Minister
- S3 E11: Dissecting Cast Magic's Output With Guest Greg Wasserman
- S3 E10 Successful Podcasters: Reena Friedman Watts Of The Better Call Daddy Podcast
- S3 E9 Why Podcasters Need Canva For Podcast Marketing
- S3 E8 How Does AI Define Podcasting And What Equipment Does AI Think You Need To Podcast?
- S3 E7 - Why Your Podcast Is Not Growing Fast Enough
- S3E6 - Podsafe Music 4th Of July With Shari
- S3 E5 - Does Your Podcast Need A Script?
- S3 E4 - Is SoundCloud Really A Good Platform For Podcasts? Should You Be On It?
- S3 E3 - How To Make Good Money Playing Podsafe Music On Your Podcast
- S3 E2 - Jay Fairbrother - Mastermind Groups For Podcasters Featuring The Music Of Lian Gold
- Why Are There So Many Podcasters Today? The Competition Out There And How To Survive. | S3 E1
- Meet Podcast Guest JoshPele Magic - Available Now As A Guest For All Podcasts | S2 E29
- Season 2 Bloopers, Funny Moments, & Inspiration Moments In 2022 With Co-Hosts And Guests
- What Are YOUR 2023 Goals For Your Podcast? Here Are Mine... | S2 E28
- The Reasons Your Podcast Needs A Holiday Episode | S2E27
- S2 E26 - Dave Jackson From The School Of Podcasting Tells What A Good Podcast Is
- S2E25 - Quora Marketing Basics For Your Podcast
- S2E24 - 7 Reasons Why There Are So Many Podcasters And How To Compete
- S2E23 - Secrets To Getting More Podcast Downloads
- S2E21 - 10 Ways To Make Your Podcast Episodes More Exciting For Your Audience
- S2E20 - Response To 2018 Episode On Podcast Network On School Of Podcasting
- S2 E19 I Listened To 1000 Podcast Episodes (Part 2) Here Is What The Most Successful Ones Do.
- S2 E18 - What Inspired YOU To Become A Podcaster?
- S2E17 - 7 Cool Ways To Make Your Audience Come Back Every Episode
- S2E16 - 3 Surprising Ways A Blog Will Grow Your Audience FAST!
- S2E15 - Simple 3-Part Marketing Strategy For Any Podcast
- S2E14 - Take Your Audience Along On The Date
- S2E13 Is Your Podcast More Successful With Seasons, Or NO Seasons?
- S2E12 - The Fastest Way To LAUNCH Your Podcast
- S2E11 - The FASTEST Way To Edit Your Podcast
- S2E10 -How To Get High Google Rankings For Your Podcast
- S2E9 - Would Elon Musk Invest In YOUR Podcast?
- S2E8 - The Most Sought Out Podcast Categories Summer 2022
- S2E7 - How To Improve Your Podcast By Listening To Others
- S2E5 - Fresh Music Series With Hugh Macdonald & Holland Nelson And Melo Mafioso
- S2E4 - Fastest Way To Make Money Summer 2022
- S2 E3 - Monthly Podsafe Music Show For Your Podcast - 5 Songs From Singer/Songwriter Doug Cash
- S2 E2 - Monthly Podsafe Music Show With Doug Cash, Winchester 7, And Bruce Chamoff
- S2E1 - Monthly Music Show With Winchester 7 And The Runners
- EP51 - The Right Way To List Your Podcast Guests
- EP50 - Running Out Of Episode Ideas? How To Brainstorm Fast!
- EP49 - How To Become An Influencer Through Your Podcast
- EP48 - Vik Rajan Of PhoneBlogger.net And Https://videosocials.net/
- E47: Rob Intellisano Of The Amazon Hit Gravesend
- EP46 - How To Build A Podcast Community With Adrian Miller
- EP45 - Easy & Fun Podcast Editing Tips W/Professional Podcast Editor Merrill Loechner
- EP44 - Marketing Your Show On LinkedIn With Marc Halpert
- EP43 - Benefits Of A Podcast Network With Guest Rich Butler
- E42 - What Makes You Successful With Guest Tim B
- EP41 - The Best Instagram Hashtags For Podcasts
- E40 - More Benefits Of Podcasters Blogging W/ The Delaware Blogger Guest Antionette Blake
- EP39 - Why Podcasters Need A Mobile App With Guest John Lee
- E38 What Makes YOUR Podcast Successful With Guest Frank Sasso
- E37 - Facebook/Instagram Down? What Affected Podcasters Can Do.
- E36 - How To Make Single-Host Podcasts Work
- E34 Q&A With Professor Pete Alexander: My Audience Has Dropped! Now What?
- E33: Upcoming Episodes For September And October 2021
- E32 Blogging For Podcasters - The Process
- E31 Why Blogs Make Your Podcast MORE Successful
- E30 The POWER Of Your Podcast's RSS Feed (Video)
- E29 - Subscribe To Your Podcast Competition?
- E28 PodcasterLinks.com And MediaGirlNetwork.com
- E27 Successfully Podcasting With Your Smart Phone
- Daily Podcast Success Update For 9/2/2021
- E26 Best Time To Monetize Your Podcast
- E25 Can You Podcast From The Airport? From Las Vegas...
- E24 Treat Your Podcast Like A Lobster Roll
- E22 Do Guests Really Enhance Your Show?
- Daily Success Update:Education Podcasts Wed, Aug 11, 2021
- E21 Connecting With Your Podcast Audience To Grow Faster
- Daily Success Briefing Fri, Aug 8, 2021
- E20 Search Engine Optimization Strategies For Your Podcast
- E19 Podcasting During The Delta Variant Of Covid19
- E17 How To Beat The Competition On Apple Podcasts
- E16 Rapid Podcast Editing & Avoiding Pod Fade
- E14 Dual Podcast With Guest Podcaster Antionette Blake Part 2
- E13 Dual Podcast With Guest Podcaster Antionette Blake Part 1
- E12 How To Get More Engagement For Your Podcast Episodes With Guest Interviews
- E11 My Special Guests: Jeff And Jim Wood Of SwimAble
- E10 Surprise Visit To Philadelphia And Atlantic City
- E9: Special Guest Dominique Carson Journalist & Certified Massage Therapist
- E8: 8 Fun Audacity Effects For Podcasters
- PodKnow 2021 Online Podcasting Event With Conference Speaker: Merrill Loechner
- E5: I Listened To Over 1,000 Podcast Episodes And Here Is What I Found The Best Ones Do.
- E4 - Buzzsprout Was Down On Sunday, Feb 21, 2021. What That Means For YOUR Podcast. My Reaction...
- E3: Five Things To Do Right Now To Grow Your Podcast Audience Fast.
- E2 - Should Podcasts Have Beautifully Produced Introductions With Voiceover And Background Music (and What Your Audience Thinks Of It)
- E1 - Become A Successful Podcaster - Keep Listeners On Your Podcast Episodes Longer
- Become A Successful Podcaster With Bruce Chamoff - Audience Growth, Monetization, Marketing & More! (Trailer)